AEGEAN announces its trading update for Q1 2019 with total passenger traffic rising by 7% and consolidated revenue at EUR 172 mil., 4% higher than Q1 2018.
Total capacity offered increased by 5% while load factor was recorded improved in the quarter reaching 82.3% from 81.2% in the respective 2018 period.
Passengers carried on domestic flights increased by 4% το 1.1 mil. while passengers traveled on the international network increased by 9% to 1.4 mil.
Net losses after tax stood at EUR 35.2 mil. from EUR 30.8 mil. in 2018 impacted by higher fuel costs and a downward pressure on fares. This result also includes the effect of the application of IFRS 16 which (also) requires USD denominated lease obligation to be revalued causing a negative EUR 5.2 mil. valuation effect.
Cash & short-term financial investments reached EUR 552.6 mil. at period end 31.03.2019[1], following the successful issuance of the EUR 200 mil. common bond loan and the positive cash flows of the first quarter.
Mr. Dimitris Gerogiannis, CEO of AEGEAN, commented:
“The Group managed to deliver growth in revenues, passenger traffic & load factors, within the context of the European economic slowdown, however with a drop in average fares. Aegean is one of few European airlines which managed to achieve higher revenue during the first quarter of 2019, despite the increased seasonality of the Greek market.
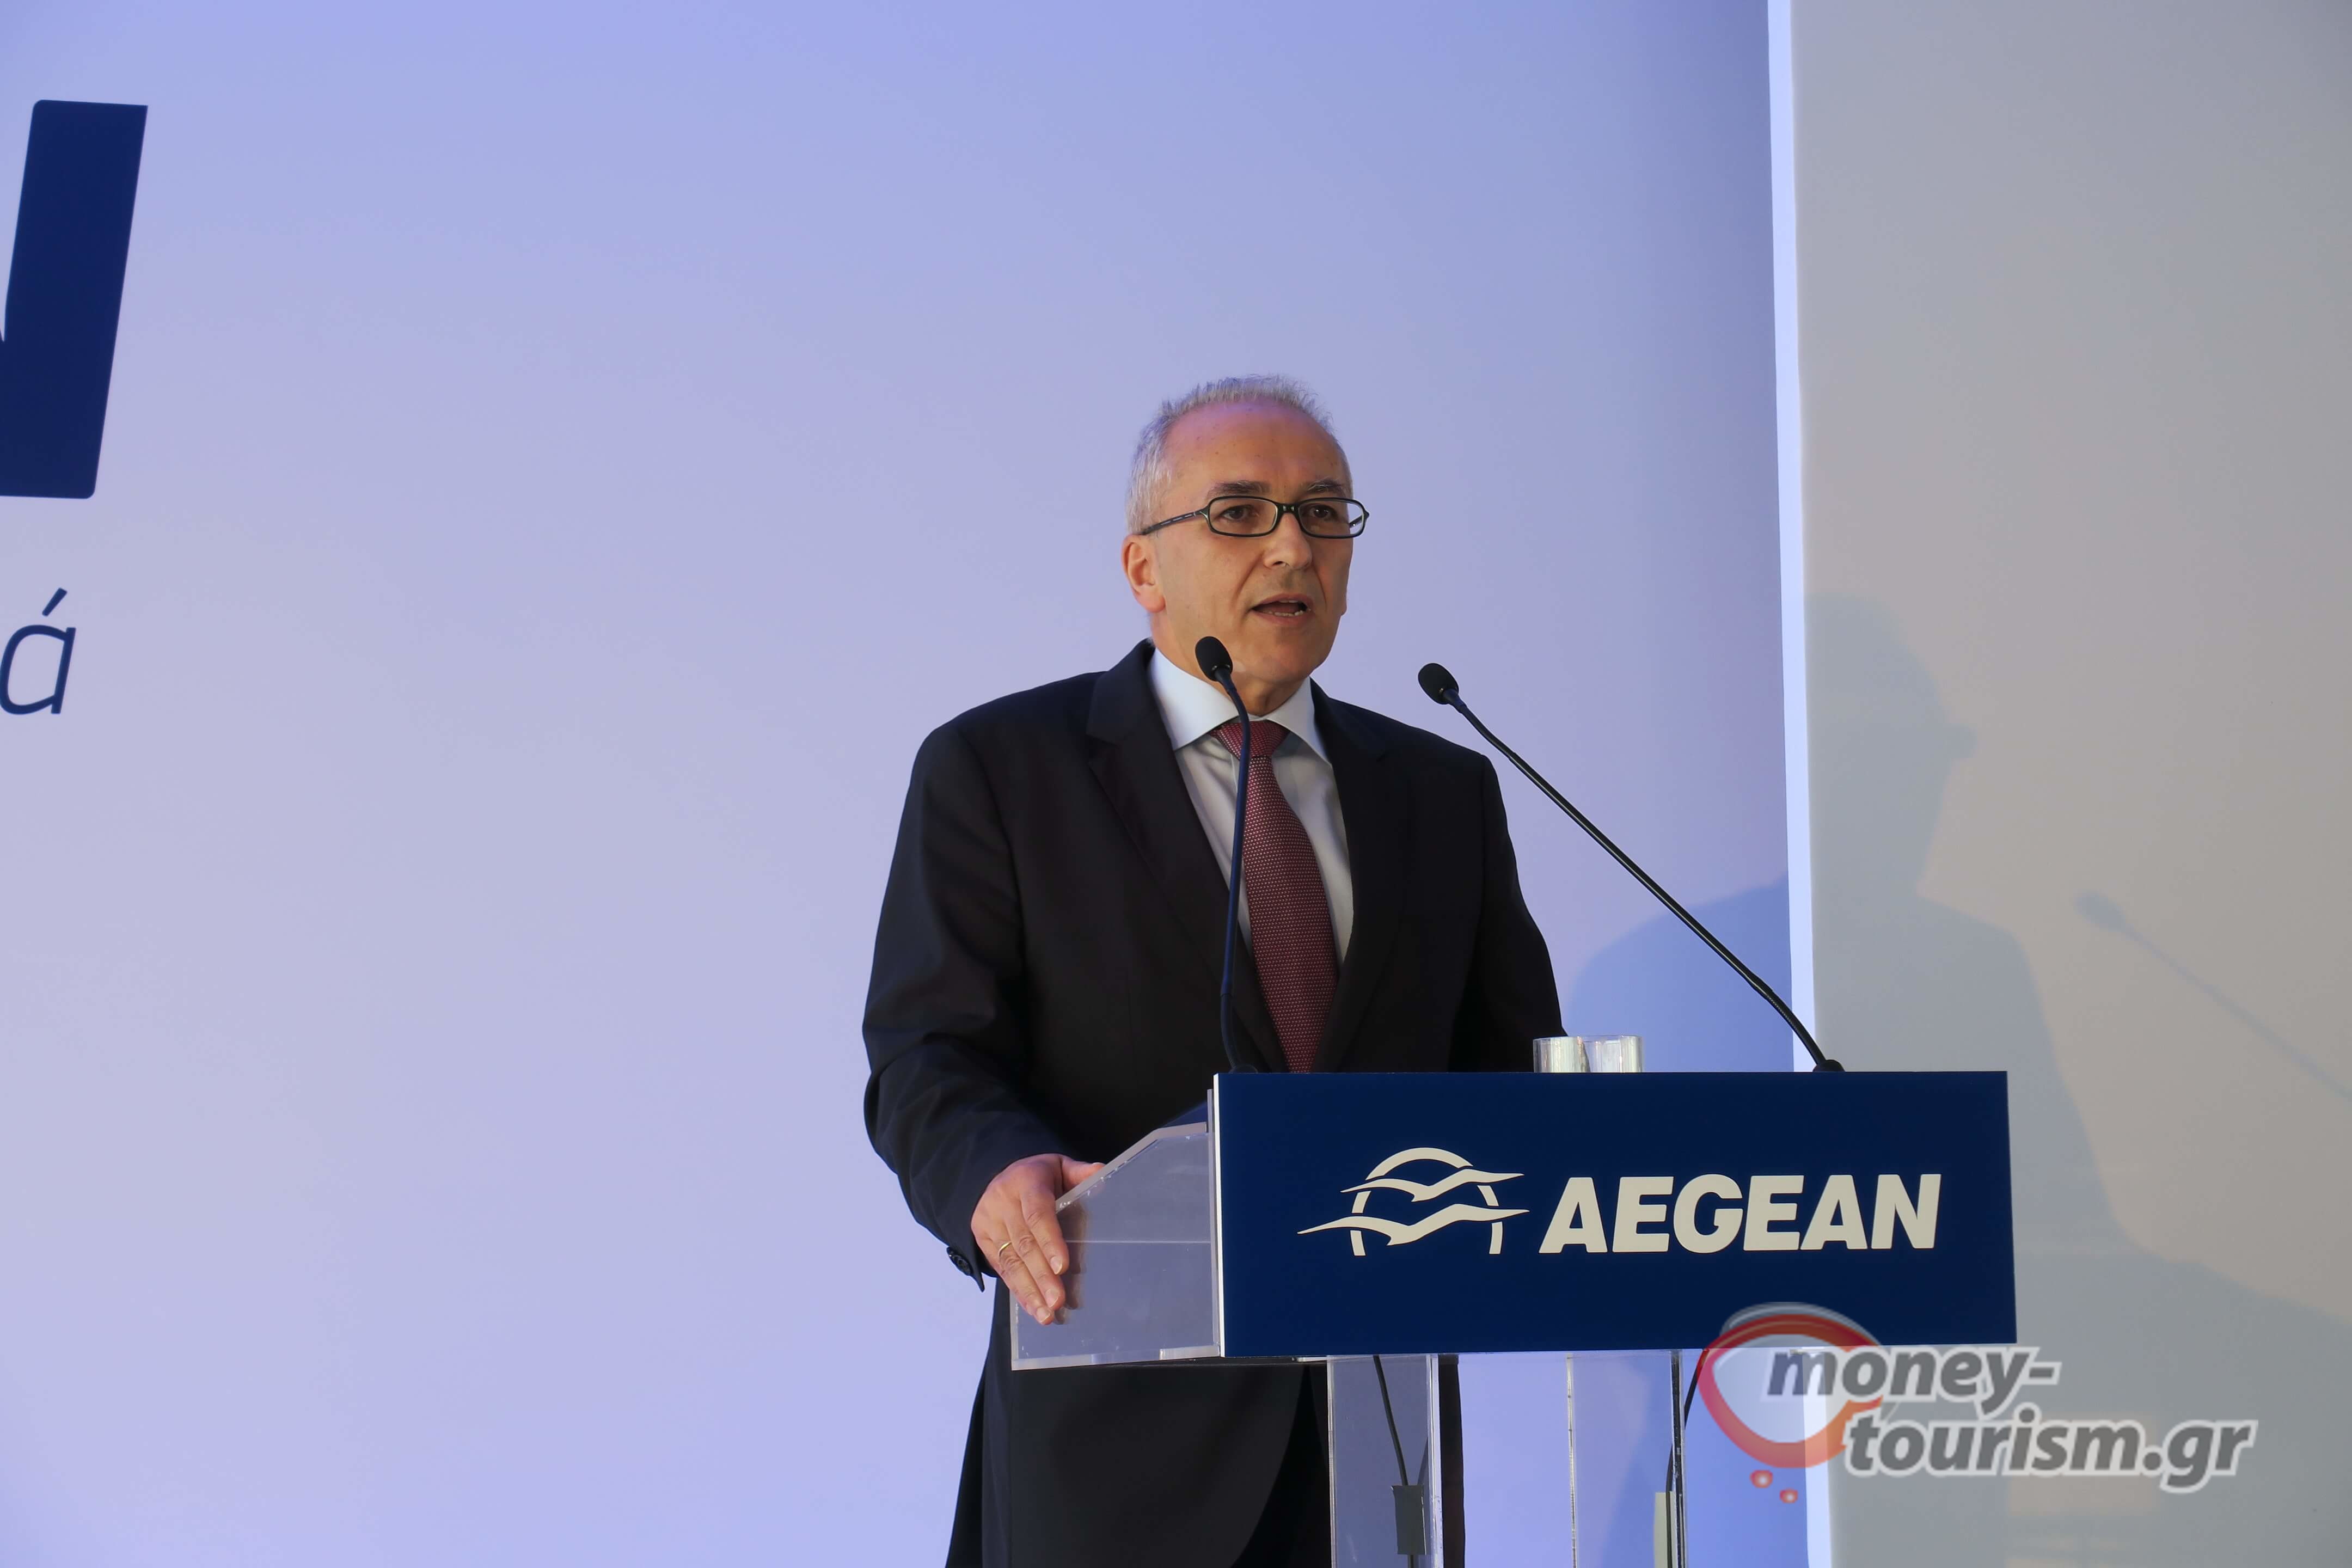
For the summer period we continue to pursue our strategy for moderate and steady growth, adding new destinations and investing in the extension of the tourism season. At the same time, we are working hard to prepare for the induction of our new Airbus A320 neo aircraft in our fleet in 2020. We remain cautiously optimistic for our progress in the following summer quarters as the trend of our bookings remains positive.”
Consolidated Results
| € million | First Quarter 2018 |
First Quarter 2019 |
% change |
| Revenue | 165,4 | 172,0 | 4% |
| EBITDAR[2] | -2,9 | -8,4 | 186% |
| EBITDA[3] | -35,5 | -8,5 | -76% |
| Pre-tax earnings / (Losses) for the period | -42,6 | -48,7 | 14% |
| Net earnings/ (Losses) for the period | -30,8 | -35,2 | 14% |
Passenger traffic (in ‘000)
| Passenger traffic | AEGEAN & Olympic Air | |||
| First Quarter 2018 |
First Quarter 2019 |
% change |
||
| Domestic | 1.077 | 1.120 | 4% | |
| International | 1.291 | 1.405 | 9% | |
| Total | 2.369 | 2.525 | 7% | |
| Load Factor | 81,2% | 82,3% | 1,1pp | |
Key Performance Indicators are posted on the company’s website http://en.about.aegeanair.com/investor-relations/financial-results/financial-results/
Given the EU directive 2013/50/EU which was transposed into Greek law (L.4374) in April 2016, AEGEAN issues trading updates with key financial and operating performance indicators for the First Quarter ending March 31 and 9-month period ending September 30 and detailed financial reports and statements for the First Half ending June 30 and Fiscal Year ending December 31.
About AEGEAN
ΑEGEAN and Olympic Air carried 14 million passengers in 2018. 2019 network covers 151 destinations (31 domestic and 120 international) to 44 countries. Since June 30, 2010 AEGEAN is a member of STAR ALLIANCE, the strongest airline alliance worldwide. The Company has been honored with the Skytrax World Airline award, as the best European regional airline in 2018.
AEGEAN at a glance
| Consolidated results | |||
| in EUR mil. | Jan – Mar 2018 | Jan – Mar 2019 | % Change |
| Revenue | 165,4 | 172,0 | 4% |
| EBITDAR | -2,9 | -8,4 | 186% |
| EBITDA | -35,5 | -8,5 | -76% |
| Pre-tax earnings for the period | -42,6 | -48,7 | 14% |
| Net earnings for the period | -30,8 | -35,2 | 14% |
| Total number of passengers (in thousands) | 2.369 | 2.525 | 7% |
| Average number of passengers per flight | 121 | 127 | 5% |
| Load factor – Scheduled services (RPK/ASK) | 81,2% | 82,3% | 1,1pp |
| Load factor – Scheduled services (Pax/AVS) | 80,2% | 81,3% | 1,1pp |
| Average sector length (km) | 869 | 869 | 0,0% |
| RASK (Revenue per ASK, in € cents) | 5,8 | 5,9 | 0,5% |
| Yield (Revenue per RPK, in € cents) | 7,2 | 7,1 | -1% |
| CASK (Cost per ASK EBITDAR level, in € cents) | 5,9 | 6,2 | 3% |
| CASK (Cost per ASK EBITDAR level, in € cents) – excl. fuel costs | 4,7 | 4,7 | 1% |
Profit & Loss account
| Consolidated results | |||
| in EUR mil. | Jan – Mar 2018 | Jan – Mar 2019 | % Change |
| Revenue | |||
| Scheduled Services | 143,0 | 144,0 | 1% |
| Charter | 4,9 | 5,6 | 14% |
| Other (ancillary, cargo, executive aviation) | 17,6 | 22,3 | 27% |
| Total revenue | 165,4 | 172,0 | 4% |
| Other operating income | 3,7 | 5,1 | 38% |
| Employee benefits | (30,0) | (31,5) | 5% |
| Aircraft fuel | (37,2) | (42,9) | 15% |
| Aircraft maintenance | (28,2) | (30,0) | 6% |
| Overflight expenses | (11,5) | (11,8) | 2% |
| Ground handling expenses | (11,6) | (12,6) | 9% |
| Airport charges | (11,8) | (13,8) | 16% |
| Catering expenses | (5,8) | (6,1) | 6% |
| Distribution expenses | (14,3) | (14,5) | 1% |
| Marketing and advertising expenses | (2,9) | (3,2) | 12% |
| Other operating expenses | (18,9) | (19,0) | 1% |
| EBITDAR | (2,9) | (8,4) | 186% |
| EBITDAR margin | -1,8% | -4,9% | |
| Aircraft leases | (32,5) | (0,1) | -100% |
| EBITDA | (35,5) | (8,5) | -76% |
| Depreciation | (4,8) | (35,3) | 632% |
| EBIT | (40,3) | (43,8) | 9% |
| EBIT margin | -24,4% | -25,5% | |
| Financial results | (2,3) | (4,9) | 111% |
| EBT | (42,6) | (48,7) | 14% |
| EBT margin | -25,7% | -28,3% | |
| Income Tax | 11,8 | 13,5 | 14% |
| Net earnings / (loss) after tax | (30,8) | (35,2) | 14% |
Balance Sheet AEGEAN Group – Summary
[1] Includes cash and cash equivalent, restricted cash and financial investments in corporate bonds and money market funds.[2] Earnings before interest, tax, depreciation and aircraft lease payments[3] Earnings before interest, tax and depreciation
| in EUR mil. | Dec 18 | Mar 19 |
| Total fixed assets | 255,1 | 634,9 |
| Cash (incl. restricted) | 271,7 | 537,9 |
| Financial assets available for sale | 18,5 | 14,6 |
| Other current assets | 180,7 | 196,8 |
| Total assets | 725,9 | 1.384,3 |
| Total equity | 277,9 | 265,9 |
| Finance lease liabilities | 22,9 | 20,7 |
| Operating lease liabilities | 0,0 | 374,9 |
| Loans | 0,0 | 196,2 |
| Other Liabilities | 425,1 | 526,5 |
| Total equity and liabilities | 725,9 | 1.384,3 |

