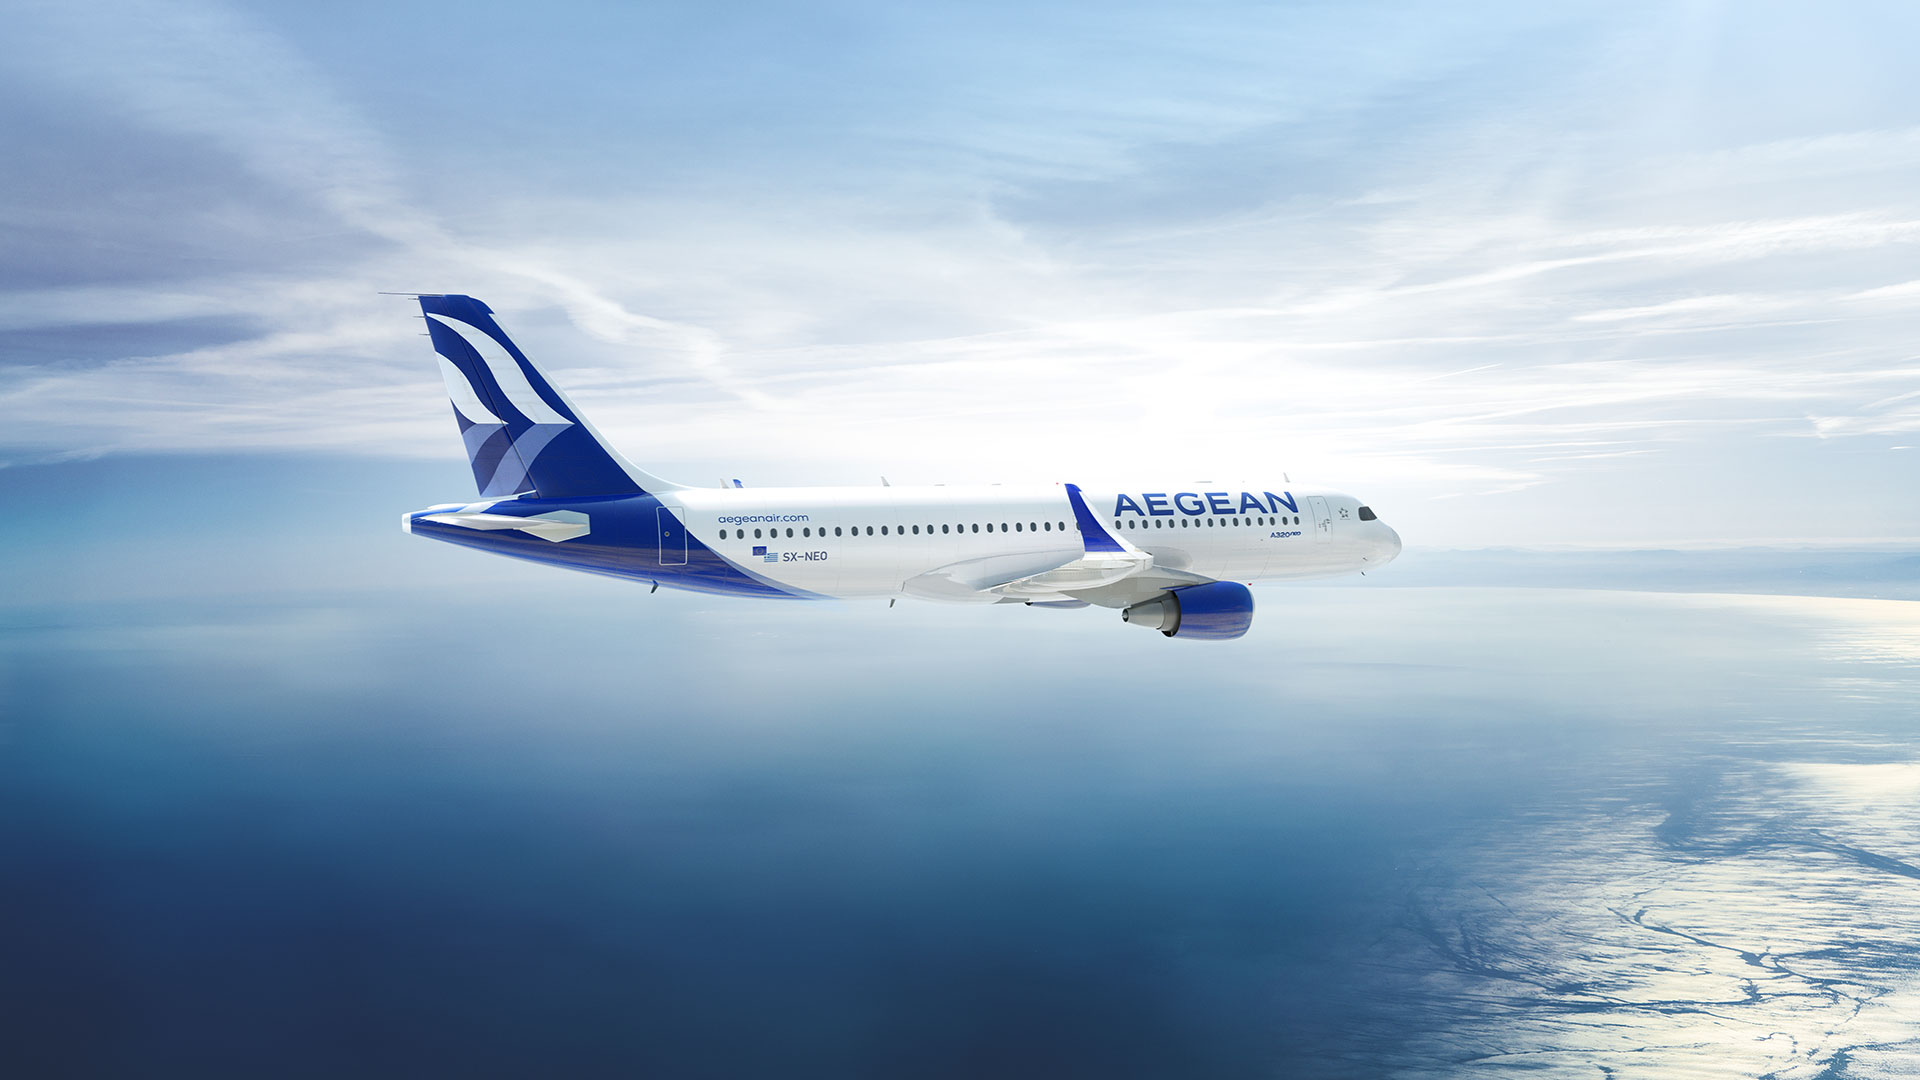
AEGEAN announces its operating and financial results for fiscal year 2022, delivering a strong performance after two years of significant losses due to the pandemic.
Consolidated revenue in 2022 reached €1,34 bil., 98% higher than 2021 and 2% more than 2019. In 2022, the Group offered 15,8 mil. seats and carried 12,5 mil. passengers, 73% more than 2021, out of which 7,3 mil. passengers traveled to/from international destinations. Load factor reached 79,8% significantly higher than 2021 (+ 14.3pp), remaining though below the pre-pandemic levels due to the impact of Q1 and Q2 of the year. The contribution of the international network to Group’s revenues reached almost 80% in 2022.
The effects of resurgence of robust demand for travel to/from Greece, the significant increase of revenue per available seat, the evolution of our fleet upgrade with a higher number of deliveries of new technology aircraft in 2022, the benefit from partial fuel hedging all came together to offset the impact of high jet fuel costs and USD appreciation.
Total FY 2022 capacity offered in ASKs reached 90% of 2019, following a gradual increase as the year progressed, with Q4 reaching 99% of the capacity and 115% of consolidated revenues of Q4 2019 at €317,4 mil. revenues, becoming the first profitable Q4 in company history with a €13,6 mil. Q4-22 Net income.
Net Income for FY 2022 reached €106,8 mil. reversing headline losses of €57,6 mil. in 2021, but also being 36% higher than Net Income of €78,5 mil. recorded in pre pandemic 2019.
Mr. Dimitris Gerogiannis, AEGEAN’s CEO, commented:
“We are very pleased that through the joint efforts of our people and the evolution of their capabilities our Group has achieved significant profitability, after two years of severe losses during the pandemic, the most difficult period in aviation history. The result validates the effectiveness of our strategy, despite the challenging start of 2022 with the war in Ukraine and the increased jet fuel cost, proving that our investment in upgrading our fleet and services, unabated during the pandemic, has started to pay off in terms of improved competitiveness.

The Board of Directors will not propose any dividend payout for the fourth consecutive year in order to maintain sufficient cash reserves to fund the new investment in the MRO Facility & Simulator Center (announced in December 2022), as well as our capacity to buy-out the rights of the Hellenic Republic upon a potential exercise of their warrants. In 2023 we will take delivery of a further 9 new Airbus A320/321neo, part of the order of a total 46 neo aircraft by 2026.
The first indications for 2023 are particularly encouraging, with international traffic in the first two months and ticket pre-sales’ trends for the upcoming summer, well above early 2022 but also versus the same period of pre-pandemic 2019. Furthermore, the use of a higher number of AIRBUS neo aircraft will bring unit cost savings in fuel per seat, partially mitigating higher interest rates impact and high inflation across Europe that will affect the suppliers and our operating costs”.
AEGEAN plans to operate with 76 aircraft in 2023 and offer a total of 18 mil. available seats, of which 11 mil. seats in its international network, i.e. 2 mil. more seats than in 2022 and 800 thousand more than in 2019. The network will cover 46 countries, with 264 routes to 161 destinations out of 8 bases.
As of 15 March 2023, AEGEAN has fully repaid all loans drawn during the pandemic from the four large Greek banks, three years prior to their maturity. Following the repayment, total cash and cash equivalents remain above €500 mil., while Net Equity has also returned to pre-pandemic levels.
The evolving investment and deliveries of Airbus A320/A321neo, the replacement of the turboprop fleet with ATR42 & 72-600 which took place gradually throughout 2022, along with the use of SAF have already contributed to a 9% reduction in CO2 emissions per ASK in 2022 vs 2019; further improvement is expected in 2023 figures.
Financial Results and Operating Metrics for the Fourth quarter and Full Year of 2022
| (in € mil.) | Q4 2021 | Q4 2022 | % change | Full Year
2021 |
Full Year
2022 |
% change |
| Revenue | 188,0 | 317,4 | 68,8% | 674,8 | 1.336,8 | 98,1% |
| Pre-tax profit/(loss) (Headline) | (39,1) | 19,9 | – | (72,1) | 141,3 | – |
| Νon-headline (exceptional income*) | – | – | – | 62,7 | – | – |
| Pre-tax profit/(loss) | (39,1) | 19,9 | – | (9,3) | 141,3 | – |
| Net profit/(loss) | (23,7) | 13,6 | – | 5,1 | 106,8 | – |
*Total non-headline (exceptional) income of €62,7 mil, which includes the state aid amount, net of the warrants valuation and a provision related to the restructuring of the fleet was recognized.
| Q4 2021 | Q4 2022 | % change | Full Year
2021 |
Full Year
2022 |
% change | |
| Total Passengers (‘000) | 2.226 | 3.069 | 38% | 7.194 | 12.465 | 73% |
| Load Factor (RPK/ASK) | 68,8% | 82,3% | 13,5pp | 65,5% | 79,8% | 14,3pp |
| ASKs (in millions) | 3.329 | 4.096 | 23% | 10.826 | 16.744 | 55% |
Κey financial and operating metrics as a percentage of the corresponding results for the period of 2019
| 2022 as a % of 2019 | Q1 2021 | Q2 2022 | Q3 2022 | Q4 2022 | Full Year
2022 |
|
| ASKs | 73% | 84% | 97% | 99% | 90% | |
| Revenue | 70% | 94% | 111% | 115% | 102% | |
| Pre-tax profit for the period | – | 56% | 123% | – | 132% | |
AEGEAN at a glance
| (in € mil.) | Fourth
Quarter 2021 |
Fourth
Quarter 2022 |
% change | Full Year
2021 |
Full Year
2022 |
% change |
| Revenue | 188,0 | 317,4 | 68,8% | 674,8 | 1.336,8 | 98,1% |
| EBITDA | 22,8 | 39,4 | 73,1% | 117,3 1 | 274,9 | 134,4% |
| Pre-tax earnings/(Loss) | (39,1) | 19,9 | – | (72,1) 1 | 141,3 | – |
| Net earnings/(Loss) | (23,7) | 13,6 | – | (57,6) 1 | 106,8 | – |
| Total passengers (In thousands) | 2.226 | 3.069 | 37,9% | 7.194 | 12.465 | 73,3% |
| Average passengers per flight | 106 | 128 | 20,8% | 97 | 123 | 27,1% |
| Load factor – Scheduled services (RPK/ASK) | 68,8% | 82,3% | 13,5 p.p. | 65,5% | 79,8% | 14,3pp |
| Load factor – Scheduled services (Pax/AVS) | 68,0% | 81,2% | 13,2 p.p. | 65,0% | 79,2% | 14,2pp |
| Average sector length (km) | 890 | 936 | 5,2% | 827 | 919 | 11,1% |
| RASK (Revenue per ASK, in € cents) | 5,8 | 8,0 | 37,8% | 6,4 1 | 8,3 | 29,8% |
| Yield (in € cents) | 8,4 | 9,8 | 15,8% | 9,7 1 | 10,4 | 6,7% |
| CASK (EBT level, in € cents) | 7,0 | 7,5 | 7,6% | 7,0 1 | 7,4 | 5,5% |
| CASK (EBT level, in € cents) – excl. fuel costs | 5,6 | 5,4 | -2,5% | 5,8 1 | 5,4 | -6,9% |
Note: 1 Excluding the impact of non-headline (exceptional) income.
Consolidated Income Statement- Fourth quarter 2022
| (in € mil.) | Q4 2021 | Q4 2022 | % change |
| Scheduled Services | 154,9 | 269,4 | 73,9% |
| Charter | 9,7 | 14,6 | 49,9% |
| Other | 23,4 | 33,4 | 42,6% |
| Total Revenue | 188,0 | 317,4 | 68,8% |
| Other operating income | 4,8 | 9,6 | 100,9% |
| Employee benefits | (19,3) | (43,1) | 123,0% |
| Aircraft fuel | (46,4) | (84,5) | 82,1% |
| Aircraft maintenance | (36,6) | (32,1) | -12,2% |
| Overflight expenses | (12,1) | (15,4) | 27,4% |
| Ground handling expenses | (13,6) | (18,4) | 34,6% |
| Airport charges | (13,4) | (16,6) | 23,7% |
| Catering expenses | (6,9) | (9,1) | 31,5% |
| Distribution expenses | (14,2) | (20,5) | 43,9% |
| Marketing & advertising expenses | (3,4) | (7,4) | 114,9% |
| Other operating expenses | 1,3 | (35,2) | – |
| Leases | (5,2) | (5,2) | -0,5% |
| EBITDA | 22,8 | 39,4 | 73,1% |
| Depreciation | (50,8) | (34,4) | -32,3% |
| EBIT | (28,0) | 5,1 | – |
| EBIT margin | -14,9% | 1,6% | – |
| Financial results | (11,1) | 14,8 | – |
| Pre-tax Profit/(Loss) | (39,1) | 19,9 | – |
| EBT margin | -20,8% | 6,3% | – |
| Income Tax | 15,4 | (6,3) | – |
| Net Profit/(Loss) after tax | (23,7) | 13,6 | – |
Consolidated Income Statement- Full Year 2022
| (in € mil.) | FY 2021 | FY 2022 | % change |
| Scheduled Services | 558,3 | 1.138,3 | 103,9% |
| Charter | 37,9 | 70,0 | 84,6% |
| Other | 78,7 | 128,5 | 63,4% |
| Total Revenue | 674,8 | 1.336,8 | 98,1% |
| Other operating income | 105,6 | 44,6 | -57,8% |
| Employee benefits | (66,9) | (133,4) | 99,5% |
| Aircraft fuel | (134,2) | (338,9) | 152,5% |
| Aircraft maintenance | (115,9) | (140,6) | 21,3% |
| Overflight expenses | (38,9) | (65,1) | 67,3% |
| Ground handling expenses | (45,4) | (73,8) | 62,6% |
| Airport charges | (41,4) | (68,3) | 64,8% |
| Catering expenses | (20,6) | (34,6) | 67,6% |
| Distribution expenses | (44,5) | (81,3) | 82,8% |
| Marketing & advertising expenses | (11,9) | (20,9) | 75,8% |
| Other operating expenses | (71,0) | (125,4) | 76,6% |
| Leases | (9,7) | (24,1) | 149,4% |
| EBITDA | 180,0 | 274,9 | 52,7% |
| EBITDA
(Excluding non-headline (exceptional) income/expense) |
117,3 | 274,9 | 134,4% |
| Depreciation | (149,9) | (127,7) | -14,8% |
| EBIT | 30,1 | 147,3 | 389,9% |
| EBIT margin | 4,5% | 11,0% | |
| EBIT
(Excluding non-headline (exceptional) income/expense) |
(32,7) | 147,3 | – |
| Financial results | (39,4) | (5,9) | -84,9% |
| Pre-tax Profit/(Loss) | (9,3) | 141,3 | – |
| EBT margin | -1,4% | 10,6% | |
| Pre-tax Profit/(Loss)
(Excluding non-headline (exceptional) income/expense) |
(72,1) | 141,3 | – |
| Income Tax | 14,4 | (34,5) | – |
| Net Profit/(Loss) after tax | 5,1 | 106,8 | – |
| Net Profit/(Loss) after tax
(Excluding non-headline (exceptional) income/expense) |
(57,6) | 106,8 | – |
Note: Total non-headline (exceptional) income of €62,7 mil, which includes the state aid amount, net of the warrants valuation and a provision related to the restructuring of the fleet was recognized.
Balance Sheet Aegean Group- Summary
| (in € mil.) | 31.12.2021 | 31.12.2022 | ||||
| Total Fixed Assets | 814,3 | 1.203,3 | ||||
| Cash & Cash Equivalents | 462,11 | 463,71 | ||||
| Financial Assets Available for Sale | 12,3 | 64,22 | ||||
| Other Current Assets | 251,7 | 289,2 | ||||
| Total Assets | 1.540,4 | 2.020,4 | ||||
| Total Equity | 213,6 | 348,1 | ||||
| Lease Liabilities | 414,2 | 737,3 | ||||
| Loans | 346,2 | 268,2 | ||||
| Other Liabilities | 566,3 | 666,8 | ||||
| Total Equity and Liabilities | 1.540,4 | 2.020,4 |
Note:
1. Includes restricted cash of €19,5 mil. on 31/12/2021, and restricted cash of €1,4 mil. on 31/12/2022
- Includes pledged fixed income securities of €10,4 mil. on 31/12/2022.
Cash Flow Aegean Group- Summary
| (in € mil.) | 31.12.2021 | 31.12.2022 | ||||
| Net cash flows from operating activities | 211,5 | 350,2 | ||||
| Net cash flows from investing activities | (24,4) | (163,8) | ||||
| Net cash flows from financing activities | (186,6) | (162,2) | ||||
| Net (decrease)/ increase in cash and cash equivalents | 0,5 | 24,2 | ||||
| Cash at the beginning of the period | 437,1 | 442,6 | ||||
| Foreign exchange difference impact in cash | 5,0 | (4,5) | ||||
| Cash at the end of the period | 442,6 | 462,3 |
Group operating figures
| Q4 2021 | Q4 2022 | % change | FY 2021 | FY 2022 | % change | |
| Capacity | ||||||
| ASKs (in millions) | 3.329 | 4.096 | 23,0% | 10.826 | 16.744 | 54,7% |
| Total available seats (000) | 3.305 | 3.808 | 15,2% | 11.153 | 15.803 | 41,7% |
| Total Block Hours | 33.785 | 40.760 | 20,6% | 113.143 | 173.914 | 53,7% |
| Total Sectors Flown | 20.942 | 23.899 | 14,1% | 74.343 | 101.340 | 36,3% |
| Average capacity per flight | 158 | 159 | 1,0% | 150 | 156 | 3,9% |
| Average sector length (km) | 890 | 936 | 5,2% | 827 | 919 | 11,1% |
| Passengers (΄000) | ||||||
| By type of service: | ||||||
| Schedule passengers | 2.184 | 2.996 | 37,2% | 6.964 | 11.963 | 71,8% |
| Charter passengers | 42 | 73 | 75,9% | 230 | 502 | 118,6% |
| By network: | ||||||
| Domestic | 1.002 | 1.186 | 18,4% | 3.447 | 5.129 | 48,8% |
| International | 1.224 | 1.883 | 53,8% | 3.747 | 7.336 | 95,8% |
| Total number of passengers | 2.226 | 3.069 | 37,9% | 7.194 | 12.465 | 73,3% |
| RPKs (in millions) | 2.285 | 3.347 | 46,5% | 7.082 | 13.327 | 88,2% |
| Average passengers per flight | 106 | 128 | 20,8% | 97 | 123 | 27,1% |
| Load factor- Scheduled Services (Pax/AVS) | 68,0% | 81,2% | 13,2pp | 65,0% | 79,2% | 14,2pp |
| Load factor- Scheduled Services (RPK/ASK) | 68,8% | 82,3% | 13,5pp | 65,5% | 79,8% | 14,3pp |


