AEGEAN announces a trading update for the third quarter and nine-month period ending September 30, 2020.
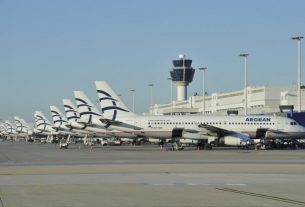
The partial lifting of travel restrictions across Europe as of July allowed the gradual resumption of international flights. Nevertheless, several countries remained inaccessible, demand was weak due to the pandemic while the lack of coordination on travel protocols weighed on the restart efforts. During the third quarter of 2020, AEGEAN operated 49% less flights than in 2019 while passenger traffic was 62% lower than last year. Load factors fell to 65,7% from 87,7%. Even under these restrictions the Company carried 2 mil. passengers in the quarter, flying to 78 international and domestic destinations.
With the course of the pandemic and the renewed restrictions, especially after August, determining the level of operations, revenue during the third quarter stood at €155,1 mil. from €512,5 mil. in 2019 while net losses after tax reached €28,3 mil. from net earnings of € 90,2 mil. in the same period in 2019.
Overall in the Nine-month period revenue reached €342,5 mil. from €1,031 bn in 2019, while passenger traffic reached 4,4 mil. passengers. Net losses after tax for the Nine-Month period totaled €187,1 mil. from net earnings of €77,1 mil. in the respective period last year.
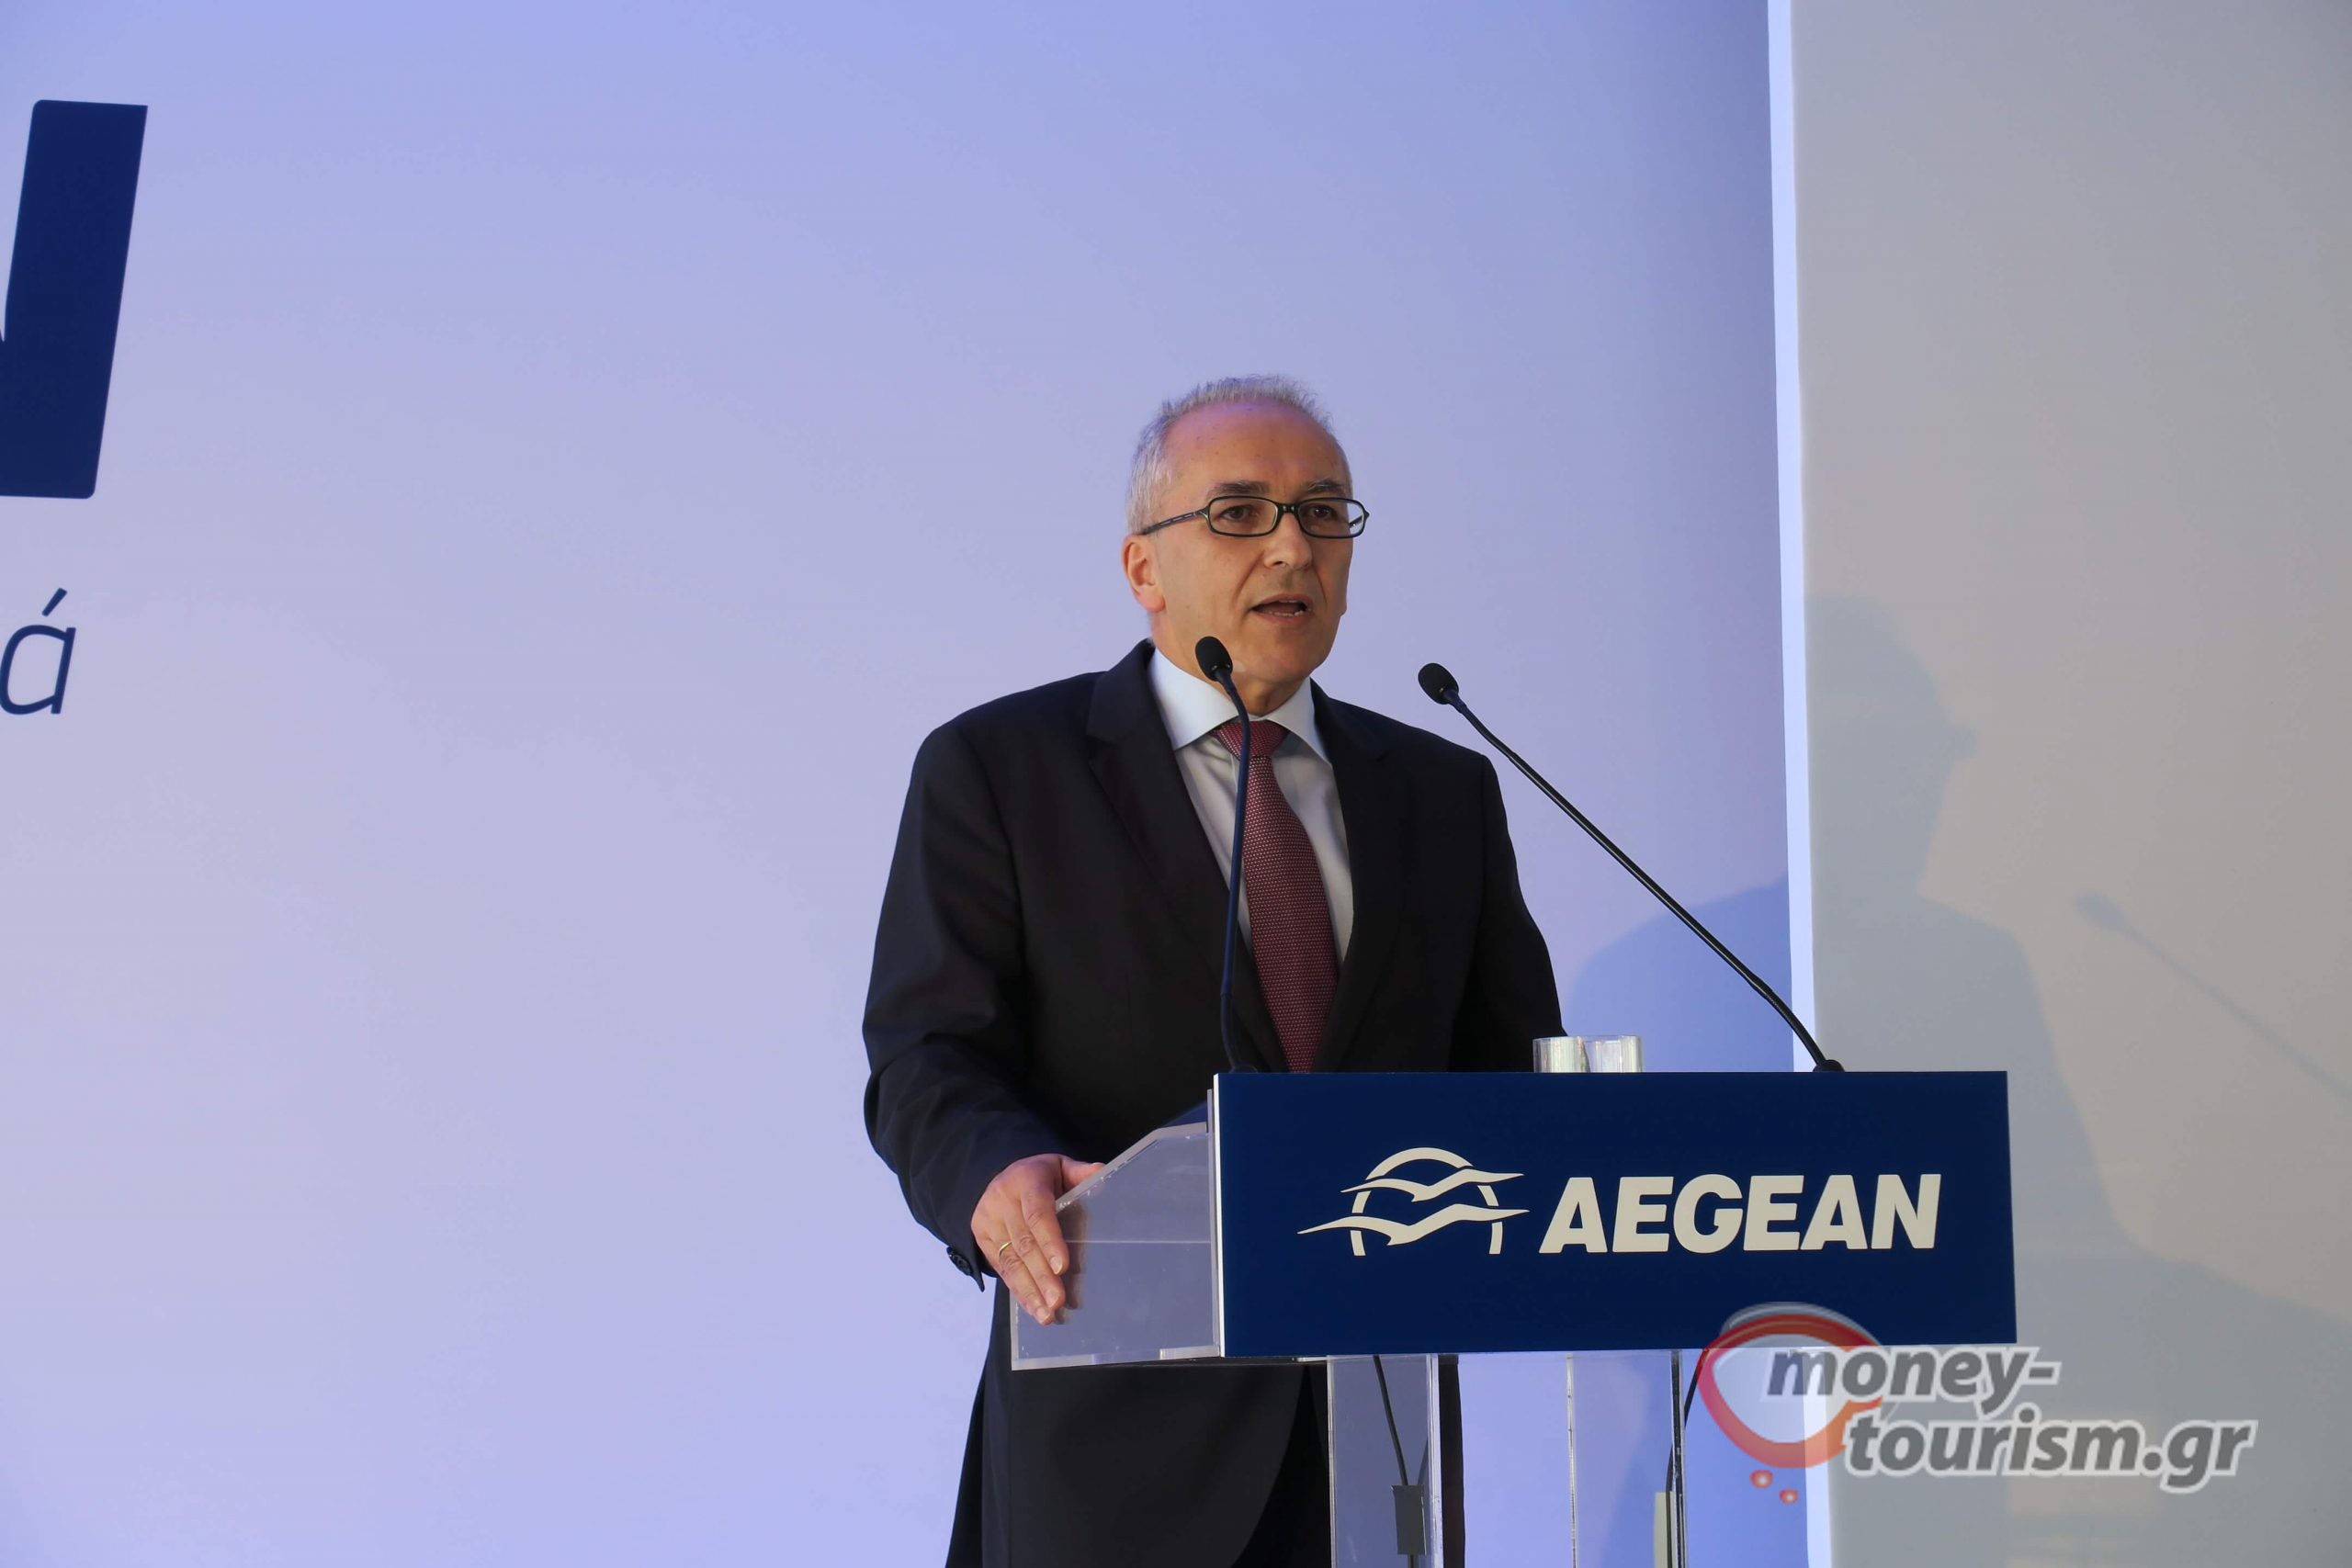
Mr. Dimitris Gerogiannis, CEO of AEGEAN, commented: “During Q3 we also resumed our international operations, wherever possible, implementing strict health measures onboard our aircraft. We are proud that our efforts have been recognized by Skytrax, with the Company receiving a 4-star COVID-19 Airline Safety Rating. We welcomed 2 mil. passengers and managed to limit losses to one third of the losses recorded in the previous (Q2) quarter.
For the winter 2020/21 season the second wave of the pandemic, renewed travel restrictions and recently lockdowns across Europe and Greece will limit our activity to levels lower than 20% of the respective 2019 period.
The possibility of the initiation of vaccine distribution in the early 2021 as well as the adoption of common travel protocols could potentially allow for a gradual and partial recovery as 2021 progresses. We continue to focus the necessary flexibility to cater for the needs of our customers in a constantly changing environment while also exploring possible measures to support our financial position”.
Cash and short-term financial investments reached €433,3 mil. at period end 30.09.2020 while borrowings outstanding (Bank Debt and Bond Loan) reached €290 mil.[1]
The Company has taken delivery of the 7th NEO aircraft of the Airbus A320NEO family on November 21th (and the second A321) of the total order of 46 aircraft.
Consolidated Results
| € million | Third Quarter 2019 | Third Quarter 2020 | % | Nine Month 2019 | Nine Month 2020 | % |
| Revenue | 512,5 | 155,1 | -70% | 1.031,9 | 342,5 | -67% |
| EBITDA[2] | 168,1 | 2,5 | -98% | 230,8 | (47,0) | – |
| Pre-tax profit (losses) for the period | 123,7 | (36,8) | n.m. | 106,6 | (237,6) | n.m. |
| Net profit (losses) for the period | 90,2 | (28,3) | n.m. | 77,1 | (187,1) | n.m. |
*Extraordinary result relates to hedging ineffectiveness losses
Passenger traffic
| Third Quarter 2019 | Third Quarter 2020 | % | Nine Month 2019 | Nine Month 2020 | % | |
| Passengers (,000) | 5.181 | 1.948 | -62% | 11.633 | 4.411 | -62% |
| Flights | 39.368 | 20.096 | -49% | 90.420 | 44.535 | -51% |
| Load Factor (RPK/ASK | 87,7% | 65,7% | -21,9pp | 84,5% | 69,5% | -15,1pp |
About AEGEAN
ΑEGEAN and its subsidiary Olympic Air carried 15 million passengers in 2019.
The Company has been honored, for the ninth consecutive year and tenth time in the last 11 years, with the Skytrax World Airline award, as the best European regional airline in 2019.
AEGEAN at a glance
| Consolidated results (in € mil.) | Jul – Sep 2019 | Jul – Sep 2020 | Change in % | Jan – Sep 2019 | Jan – Sep 2020 | Change in % |
| Revenue | 512,5 | 155,1 | -70% | 1031,9 | 342,5 | -67% |
| EBITDA | 168,1 | 2,5 | -98% | 230,8 | (47,0) | – |
| Pre-tax earnings/(Losses) | 123,7 | (36,8) | – | 106,6 | (237,6) | – |
| Net earnings/(Losses) | 90,2 | (28,3) | – | 77,1 | (187,1) | – |
| Total number of passengers (in thousands) | 5.181 | 1.948 | -62% | 11.633 | 4.411 | -62% |
| Average number of passengers per flight | 132 | 97 | -26% | 129 | 99 | -23% |
| Load factor – Scheduled services (RPK/ASK) | 87,7% | 65,7% | -21,9pp | 84,5% | 69,5% | -15,1pp |
| Load factor – Scheduled services (Pax/AVS) | 87,1% | 68,4% | -18,7pp | 83,9% | 69,0% | -14,9pp |
| Average sector length (km) | 931 | 787 | -15% | 921 | 782 | -15% |
| RASK (Revenue per ASK, in € cents) | 8,2 | 5,9 | -28% | 7,2 | 6,0 | -17% |
| Yield (Revenue per RPK, in € cents) | 9,3 | 8,9 | -4% | 8,5 | 8,7 | 1% |
| CASK (EBT level, in € cents) | 6,2 | 7,3 | 17% | 6,5 | 10,0 | 54% |
| CASK (EBT level, in € cents) – excl. fuel costs | 4,7 | 5,9 | 25% | 5,0 | 8,5 | 70% |
Profit & Loss account
| Consolidated results (in € mil.) | Jul – Sep 2019 | Jul – Sep 2020 | Change in % | Jan – Sep 2019 | Jan – Sep 2020 | Change in % |
| Revenue | ||||||
| Scheduled Services | 427,6 | 130,2 | -70% | 860,9 | 285,8 | -67% |
| Charter | 37,7 | 6,7 | -82% | 67,0 | 9,9 | -85% |
| Other | 47,2 | 18,2 | -62% | 104,0 | 46,8 | -55% |
| Total revenue | 512,5 | 155,1 | -70% | 1.031,9 | 342,5 | -67% |
| Other operating income | 4,0 | 2,0 | -51% | 12,8 | 9,5 | -26% |
| Employee benefits | (40,0) | (19,7) | -51% | (107,4) | (62,1) | -42% |
| Aircraft fuel | (97,8) | (37,4) | -62% | (217,1) | (90,6) | -58% |
| Aircraft maintenance | (62,0) | (34,2) | -45% | (140,3) | (70,3) | -50% |
| Overflight expenses | (24,3) | (9,9) | -59% | (55,9) | (22,1) | -60% |
| Ground handling expenses | (24,1) | (11,8) | -51% | (55,7) | (26,0) | -53% |
| Airport charges | (19,0) | (8,1) | -57% | (52,5) | (24,9) | -53% |
| Catering expenses | (11,9) | (5,3) | -55% | (27,8) | (11,8) | -58% |
| Distribution expenses | (30,4) | (11,0) | -64% | (66,8) | (31,3) | -53% |
| Marketing & advertising expenses | (4,8) | (1,4) | -71% | (12,8) | (6,7) | -48% |
| Other operating expenses | (33,5) | (15,6) | -53% | (76,1) | (51,2) | -33% |
| Leases | (0,6) | (0,1) | -78% | (1,5) | (2,0) | 35% |
| EBITDA | 168,1 | 2,5 | -98% | 230,8 | (47,0) | – |
| Depreciation | (36,8) | (37,3) | 1% | (108,9) | (110,4) | 1% |
| EBIT | 131,3 | (34,7) | – | 121,9 | (157,4) | – |
| EBIT margin | 25,6% | -22,4% | 11,8% | -46,0% | ||
| Financial results | (7,5) | (2,0) | -73% | (15,3) | (80,2) | 424% |
| Pre-tax earnings/(Losses) | 123,7 | (36,8) | – | 106,6 | (237,6) | – |
| EBT margin | 24,1% | -23,7% | 10,3% | -69,4% | ||
| Income Tax | (33,6) | 8,5 | – | (29,4) | 50,6 | – |
| Net earnings/(Losses) after tax | 90,2 | (28,3) | – | 77,1 | (187,1) | – |
Balance Sheet AEGEAN Group – Summary
| (in € mil.) | December 2019 | September 2020 |
| Total Fixed Assets | 618,0 | 774,0 |
| Cash & Cash Equivalents | 505,1 | 421,3 |
| Financial Assets Available for Sale | 11,8 | 12,0 |
| Other Current Assets | 198,6 | 167,3 |
| Total Assets | 1.333,4 | 1.374,6 |
| Total Equity | 328,4 | 100,8 |
| Lease Liabilities | 343,2 | 393,4 |
| Loans | 198,7 | 289,6 |
| Other Liabilities | 463,0 | 590,8 |
| Total Equity and Liabilities | 1.333,4 | 1.374,6 |
Cashflow AEGEAN Group – Summary
| (in € mil.) | Jan – Sep 2019 | Jan – Sep 2020 |
| Net cash flows from operating activities | 303 | (16) |
| Net cash flows from investing activities | (18) | (46) |
| Net cash flows from financing activities | 56 | (16) |
| Net (decrease)/ increase in cash and cash equivalents | 340 | (78) |
| Cash at the beginning of the period | 272 | 505 |
| Foreign exchange difference impact in cash | 6 | (6) |
| Cash at the end of the period | 618 | 421 |
Operating figures (AEGEAN & Olympic Air)
| Jul – Sep 2019 | Jul – Sep 2020 | Change in % | Jan – Sep 2019 | Jan – Sep 2020 | Change in % | |
| Capacity | ||||||
| ASKs (in millions) | 6.323 | 2.672 | -58% | 14.438 | 5.880 | -59% |
| Total available seats (000) | 5.957 | 2.870 | -52% | 13.879 | 6.425 | -54% |
| Total Block Hours | 65.990 | 29.282 | -56% | 151.189 | 65.294 | -57% |
| Total Sectors Flown | 39.368 | 20.096 | -49% | 90.420 | 44.535 | -51% |
| Average capacity per flight | 151 | 143 | -6% | 154 | 144 | -6% |
| Average sector length (km) | 931 | 787 | -15% | 921 | 782 | -15% |
| Passengers (000) | ||||||
| By type of service: | ||||||
| Schedule passengers | 4.831 | 1.889 | -61% | 10.995 | 4.319 | -61% |
| Charter passengers | 350 | 59 | -83% | 638 | 91 | -86% |
| By network: | ||||||
| Domestic | 2.137 | 1.067 | -50% | 4.904 | 2.291 | -53% |
| International | 3.044 | 881 | -71% | 6.729 | 2.120 | -69% |
| Total number of passengers | 5.181 | 1.948 | -62% | 11.633 | 4.411 | -62% |
| RPKs (in millions) | 5.563 | 1.756 | -68% | 12.232 | 4.066 | -67% |
| Pax/flight | 132 | 97 | -26% | 129 | 99 | -23% |
| Load factor- Scheduled (Pax/AVS) | 87,1% | 68,4% | -18,7pp | 83,9% | 69,0% | -14,9pp |
| Load factor- Scheduled (RPK/ASK) | 87,7% | 65,7% | -21,9pp | 84,5% | 69,5% | -15,1pp |
[1] Total borrowings increased by €150m at the end of October with the Company drawing down additional debt guaranteed by the Hellenic Development Bank
[2] EBITDA: Earnings (Losses) before interest, tax, depreciation & amortization