AEGEAN announces the financial and operating results for the second quarter and the first half of the year.
The restrictive measures in force until mid-May continued to weigh heavily on Group’s activity and results. However, the efforts to adjust flight operations within these restrictions in conjunction with cost management and gradual flight activity re-start towards the end of the quarter contributed to positive cash flows and the reduction in total losses in the second quarter of the year.
During the second quarter, Group’s activity remained at low levels, i.e. 35% of 2019 activity in ASK’s, being although significantly higher relative to 2020. More specifically, the Group operated more than 15,000 flights and carried 1,2 mil. passengers.
Consolidated revenue during the second quarter stood at €108,6 mil, 168,8% higher compared to 2020. Net losses after tax came to €33,9 mil., reduced from losses of €73,4 mil. in the second quarter of 2020.
Following the second quarter, consolidated revenue in the first half of the year stood at €152,8 mil, 18,4% lower while net losses after tax stood at €78,4 mil. from €158,8 mil. recorded in the first half of 2020.
Cash flow from operations in the second quarter was positive for the first time since the pandemic outbreak in March 2020, mainly due to the increase of tickets pre-sales for the summer. Cash and cash equivalent stood at €545,7 mil. on 30.06.2021, including the €60 mil. share capital increase completion but not including the EU approved State Aid which was received in early July 2021 (second half of the year).

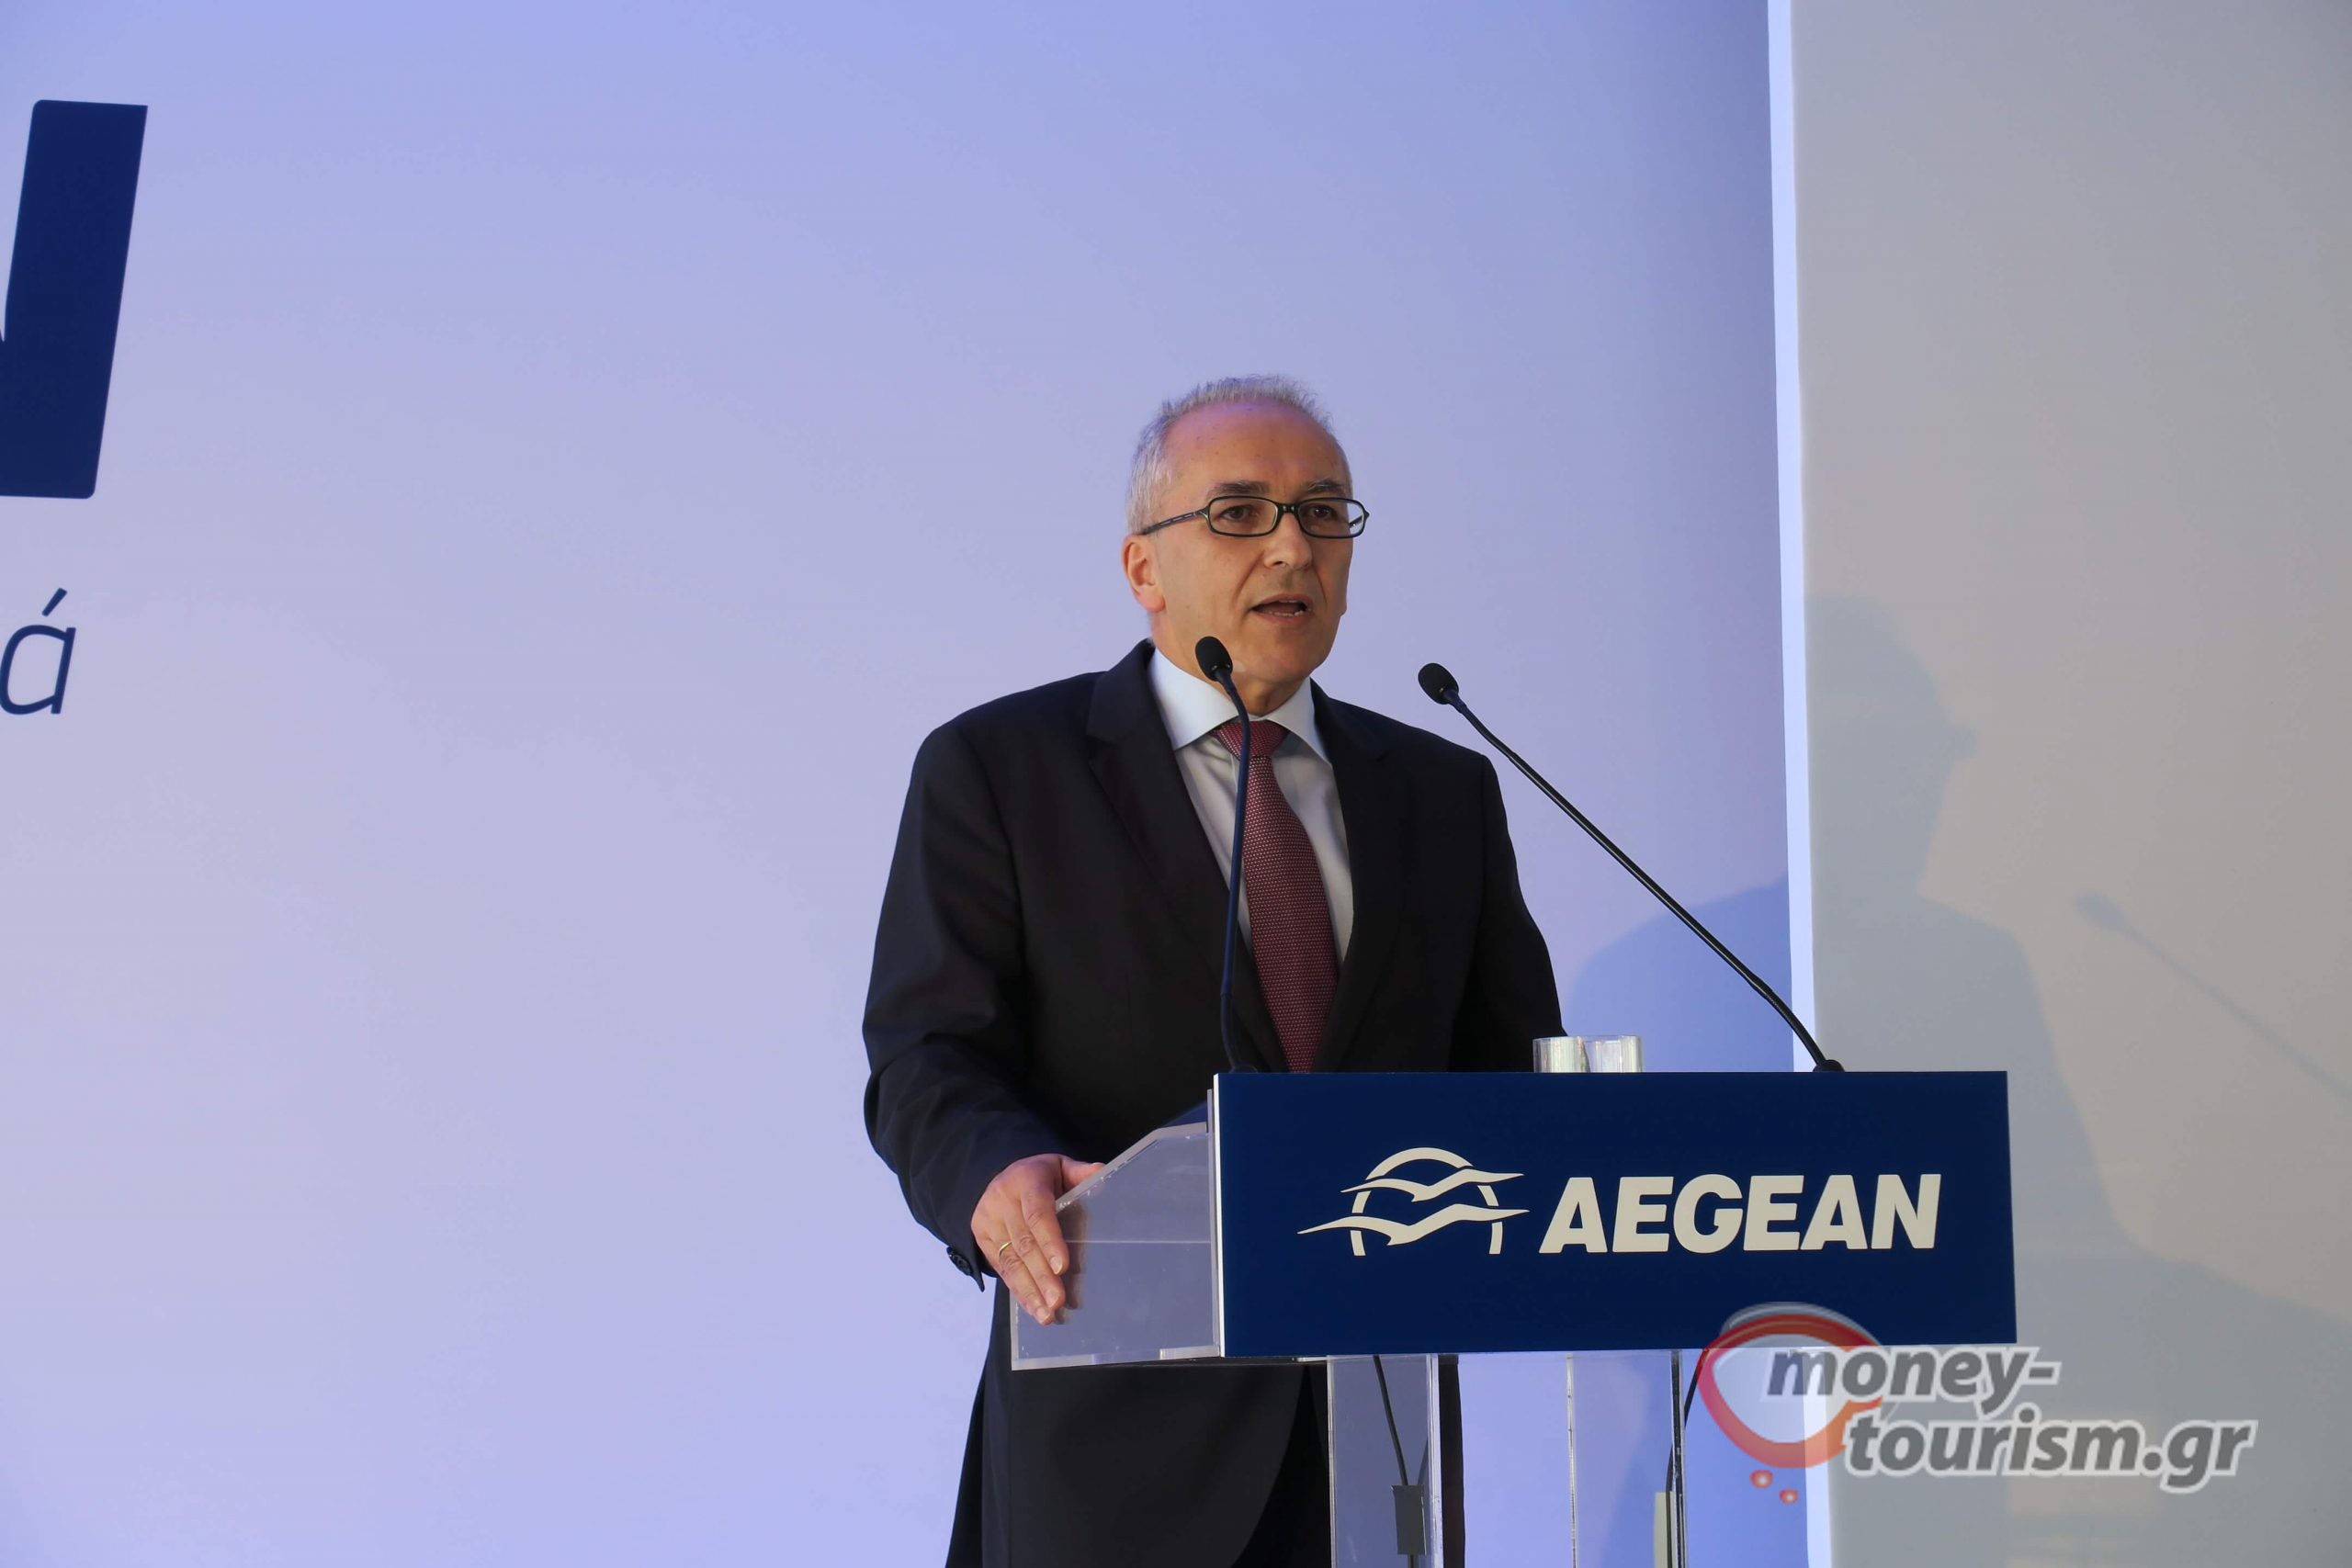
Mr. Dimitris Gerogiannis, AEGEAN’s CEO, commented: “Since late May, following the easing of travel restrictions, air traffic showed signs of significant recovery. We achieved for the first-time positive cash flows for the quarter, after 18 months and got on track for a summer season closer to normal. The recovery in travel demand evidenced in the third quarter, especially towards Greece and our increased activity from several bases to important source markets, yielded a significant gain in passengers in July and August reaching 2.3 mil. passengers, as we have already announced a few days ago. We are moving forward with our investments in fleet, product and training, while being mindful of the significant challenges remaining ahead due to the pandemic”.
Consolidated Results
| in € mil. | 1st quarter 2020 | 1st quarter 2021 | % | 2nd quarter 2020 | 2nd quarter 2021 | % | 1st half 2020 | 1st half 2021 | % |
| Revenue | 147,0 | 44,3 | -69,9% | 40,4 | 108,6 | 168,8% | 187,4 | 152,8 | -18,4% |
| EBITDA[1] | (34,1) | (14,0) | – | (15,5) | 3,9 | – | (49,6) | (10,1) | – |
| Pre-tax profit/(losses) for the period | (112,3) | (56,9) | – | (88,5) | (34,8) | – | (200,8) | (91,8) | – |
| Net profit/ (losses) for the period | (85,4) | (44,5) | – | (73,4) | (33,9) | – | (158,8) | (78,4) | – |
Passenger traffic
| 1st quarter 2020 | 1st quarter 2021 | % | 2nd quarter 2020 | 2nd quarter 2021 | % | 1st half 2020 | 1st half 2021 | % | |
| Passengers (,000) | 2.135 | 460 | -78,5% | 328 | 1.190 | 262,8% | 2.463 | 1.650 | -33,0% |
| Flights | 18.752 | 7.883 | -58% | 5.681 | 15.022 | 164% | 24.433 | 22.905 | -6,3% |
| Load Factor (RPK/ASK) | 76,0% | 47,5% | -28,5pp | 50,8% | 55,8% | 5,0pp | 72,5% | 53,1% | -19,5pp |
Key Performance Indicators are posted on the company’s website http://en.about.aegeanair.com/investor-relations/financial-results/financial-results/
About AEGEAN
ΑEGEAN and its subsidiary Olympic Air carried 15 million passengers in 2019.
The Company has been awarded, for the ninth consecutive year and tenth time in the last 11 years, with the Skytrax World Airline award, as the best European regional airline in 2019.
AEGEAN at a glance
| Consolidated results (in EUR mil.) | Jan-Mar 2020 | Jan-Mar 2021 | Change in % | Apr- Jun 2020 | Apr- Jun 2021 | Change in % | Jan- Jun 2020 | Jan- Jun 2021 | Change in % |
| Revenue | 147,0 | 44,3 | -69,9% | 40,4 | 108,6 | 168,8% | 187,4 | 152,8 | -18,4% |
| EBITDA | (34,1) | (14,0) | -58,9% | (15,5) | 3,9 | – | (49,6) | (10,1) | -79,7% |
| Pre-tax earnings / (Losses) for the period | (112,3) | (56,9) | -49,3% | (88,5) | (34,8) | -60,6% | (200,8) | (91,8) | -54,3% |
| Net earnings / (Losses) for the period | (85,4) | (44,5) | -47,9% | (73,4) | (33,9) | -53,8% | (158,8) | (78,4) | -50,6% |
| Total number of passengers (in thousands) | 2.135 | 460 | -78,5% | 328 | 1.190 | 262,8% | 2.463 | 1.650 | -33,0% |
| Average number of passengers per flight | 114 | 58 | -48,8% | 58 | 79 | 37,2% | 101 | 72 | -28,5% |
| Load factor – Scheduled services (RPK/ASK) | 76,0% | 47,5% | -28,5pp | 50,8% | 55,8% | 5,0pp | 72,5% | 53,1% | -19,5pp |
| Load factor – Scheduled services (Pax/AVS) | 75,0% | 44,5% | -30,5pp | 47,1% | 56,0% | 8,9pp | 69,5% | 52,2% | -17,3pp |
| Average sector length (km) | 858 | 660 | -23,1% | 508 | 698 | 37,2% | 777 | 685 | -11,9% |
| RASK (Revenue per ASK, in € cents) | 5,6 | 5,4 | -3,5% | 9,4 | 6,2 | -34,4% | 6,1 | 5,9 | -3,1% |
| Yield (Revenue per RPK, in € cents) | 7,3 | 11,5 | 56,7% | 18,8 | 11,1 | -40,7% | 8,4 | 11,2 | 33,0% |
| CASK (EBT level, in € cents) | 9,6 | 11,9 | 23,8% | 29,3 | 8,1 | -72,4% | 12,4 | 9,3 | -24,5% |
| CASK (EBT level, in € cents) – excl. fuel costs | 8,0 | 10,9 | 37,0% | 27,6 | 7,0 | -74,6% | 10,7 | 8,3 | -22,6% |
Profit & Loss Statement
| Consolidated results (in EUR mil.) | Jan-Mar 2020 | Jan-Mar 2021 | Change in % | Apr- Jun 2020 | Apr- Jun 2021 | Change in % | Jan- Jun 2020 | Jan- Jun 2021 | Change in % |
| Revenue | |||||||||
| Scheduled Services | 123,5 | 34,0 | -72,5% | 32,0 | 89,2 | 178,6% | 155,6 | 123,2 | -20,8% |
| Charter | 2,8 | 2,4 | -16,5% | 0,4 | 5,4 | 1239,3% | 3,2 | 7,8 | 140,4% |
| Other | 20,6 | 8,0 | -61,4% | 8,0 | 13,9 | 75,0% | 28,6 | 21,9 | -23,5% |
| Total revenue | 147,0 | 44,3 | -69,9% | 40,4 | 108,6 | 168,8% | 187,4 | 152,8 | -18,4% |
| Other operating income | 6,3 | 2,3 | -63,6% | 1,2 | 2,5 | 100,5% | 7,5 | 4,8 | -36,4% |
| Employee benefits | (31,2) | (11,0) | -64,9% | (11,3) | (14,7) | 30,3% | (42,4) | (25,6) | -39,7% |
| Aircraft fuel | (45,4) | (8,6) | -81,1% | (7,8) | (19,6) | 152,6% | (53,2) | (28,2) | -47,0% |
| Aircraft maintenance | (30,0) | (10,0) | -66,6% | (5,9) | (19,6) | 229,1% | (35,9) | (29,6) | -17,6% |
| Overflight expenses | (10,3) | (3,2) | -68,5% | (2,0) | (6,4) | 227,4% | (12,2) | (9,7) | -21,1% |
| Ground handling | (11,4) | (4,7) | -59,0% | (2,8) | (8,4) | 197,7% | (14,2) | (13,1) | -7,8% |
| Airport charges | (14,2) | (4,4) | -69,0% | (2,6) | (8,7) | 237,4% | (16,8) | (13,1) | -21,9% |
| Catering expenses | (5,9) | (1,4) | -76,3% | (0,5) | (3,7) | 588,6% | (6,5) | (5,1) | -21,8% |
| Distribution expenses | (12,9) | (3,8) | -70,5% | (4,3) | (8,0) | 85,8% | (17,3) | (11,9) | -31,3% |
| Marketing & advertising | (4,4) | (1,2) | -72,3% | (0,8) | (3,2) | 274,0% | (5,3) | (4,4) | -16,7% |
| Other expenses | (20,6) | (11,7) | -43,1% | (18,2) | (13,6) | -25,4% | (38,9) | (25,3) | -34,8% |
| Aircraft leases | (1,0) | (0,6) | -44,6% | (0,8) | (1,2) | 48,1% | (1,8) | (1,8) | -2,5% |
| EBITDA | (34,1) | (14,0) | -58,9% | (15,5) | 3,9 | – | (49,6) | (10,1) | -79,7% |
| Depreciation | (36,5) | (33,6) | -8,0% | (36,6) | (31,4) | -14,1% | (73,1) | (65,0) | -11,0% |
| EBIT | (70,6) | (47,6) | -32,6% | (52,1) | (27,5) | -47,2% | (122,6) | (75,1) | -38,8% |
| EBIT margin | -48,0% | -107,5% | -129,0% | -25,3% | -65,4% | -49,1% | |||
| Financial results | (41,8) | (9,4) | -77,6% | (36,4) | (7,3) | -79,9% | (78,2) | (16,7) | -78,7% |
| EBT | (112,3) | (56,9) | -49,3% | (88,5) | (34,8) | -60,6% | (200,8) | (91,8) | -54,3% |
| EBT margin | -76,4% | -128,6% | -219,2% | -32,1% | -107,2% | -60,0% | |||
| Income Tax | 27,0 | 12,5 | -53,8% | 15,1 | 0,9 | -93,9% | 42,1 | 13,4 | -68,2% |
| Net earnings / (loss) after tax | (85,4) | (44,5) | -47,9% | (73,4) | (33,9) | -53,8% | (158,8) | (78,4) | -50,6% |
Balance Sheet AEGEAN Group – Summary
| (in € mil.) | December 2020 | June 2021 |
| Total Fixed Assets | 838,8 | 808,9 |
| Cash & Cash Equivalents* | 466,2 | 533,4 |
| Financial Assets Available for Sale | 12,3 | 12,4 |
| Other Current Assets | 123,8 | 192,4 |
| Total Assets | 1.441,0 | 1.547,1 |
| Total Equity | 77,6 | 82,3 |
| Leases Liabilities | 425,1 | 398,2 |
| Loans | 437,2 | 437,2 |
| Other Liabilities | 501,1 | 629,4 |
| Total Equity and Liabilities | 1.441,0 | 1.547,1 |
- Includes restricted cash of 29,1 mil. eur and 6,4 mil eur in 31/12/2020 and 30/06/2020 respectively
Cashflow AEGEAN Group – Summary
| (in € mil.) | Jan – Jun 2020 | Jan – Jun 2021 |
| Net cash flows from operating activities | 14,7 | 94,5 |
| Net cash flows from investing activities | (59,0) | (5,1) |
| Net cash flows from financing activities | (23,9) | (2,1) |
| Net (decrease)/ increase in cash and cash equivalents | (68,2) | 87,3 |
| Cash and cash equivalents at the beginning of the period | 505,1 | 437,1 |
| Foreign exchange difference impact in cash and cash equivalents | (0,3) | 2,6 |
| Cash and cash equivalents at the end of the period | 436,6 | 527,0 |
Operating figures (AEGEAN & Olympic Air)
| Jan-Mar 2020 | Jan-Mar 2021 | Change in % | Apr- Jun 2020 | Apr- Jun 2021 | Change in % | Jan- Jun 2020 | Jan- Jun 2021 | Change in % | |
| Capacity | |||||||||
| ASKs (in mil.) | 2.761 | 869 | -68,5% | 444 | 1.805 | 306,8% | 3.204 | 2.673 | -16,6% |
| Total available seats (000) | 2.855 | 1.059 | -62,9% | 700 | 2.148 | 207,0% | 3.554 | 3.208 | -9,8% |
| Total Block Hours | 29.816 | 10.322 | -65,4% | 6.162 | 20.268 | 228,9% | 35.978 | 30.590 | -15,0% |
| Total Sectors Flown | 18.752 | 7.883 | -58,0% | 5.681 | 15.022 | 164,4% | 24.433 | 22.905 | -6,3% |
| Average capacity per flight | 152 | 134 | -11,7% | 123 | 143 | 16,1% | 145 | 140 | -3,7% |
| Average sector length (km) | 858 | 660 | -23,1% | 508 | 698 | 37,2% | 777 | 685 | -11,9% |
| Passengers (000) | |||||||||
| By type of service: | |||||||||
| Schedule passengers | 2.106 | 454 | -78,4% | 325 | 1.164 | 258,3% | 2.431 | 1.619 | -33,4% |
| Charter passengers | 29 | 5 | -81,3% | 3 | 26 | 759,2% | 32 | 31 | -2,8% |
| By network: | |||||||||
| Domestic | 982 | 251 | -74,4% | 243 | 667 | 174,8% | 1.225 | 918 | -25,0% |
| International | 1.153 | 209 | -81,9% | 85 | 523 | 513,3% | 1.238 | 732 | -40,9% |
| Total number of passengers | 2.135 | 460 | -78,5% | 328 | 1.190 | 262,8% | 2.463 | 1.650 | -33,0% |
| RPKs (in mil.) | 2.088 | 405 | -80,6% | 221 | 999 | 350,2% | 2.310 | 1.404 | -39,2% |
| Pax/flight | 114 | 58 | -48,8% | 58 | 79 | 37,2% | 101 | 72 | -28,5% |
| Load factor – Scheduled (Pax/AVS) | 75,0% | 44,5% | -30,5pp | 47,1% | 56,0% | 8,9pp | 69,5% | 52,2% | -17,3pp |
| Load factor – Scheduled (RPK/ASK) | 76,0% | 47,5% | -28,5pp | 50,8% | 55,8% | 5,0pp | 72,5% | 53,1% | -19,5pp |
Definitions
| EBITDA | Earnings before net interest and financial expenses, income taxes, depreciation and amortization |
| ASKs (in millions) | Available Seat Kilometers. Represents the number of seats available multiplied by the number of kilometers those seats were flown. |
| Average capacity per flight | The ratio divides total available seats flown by total sectors flown |
| Average sector length (km) | The ratio divides total available kilometers flown by total sectors flown |
| CASK (EBITDAR level, in € cents) | The ratio divides operating expenses by the total number of ASKs. Total operating expenses exclude rentals and depreciation expenses. |
| CASK (EBITDAR level, in € cents) – excl. fuel costs | The ratio divides operating expenses excluding fuel cost by the total number of ASKs. Total operating expenses exclude rentals and depreciation expenses. |
| CASK (EBT level, in € cents) | The ratio divides total expenses (operating & financial) by the total number of ASKs |
| CASK (EBT level, in € cents) – excl. fuel costs | The ratio divides total expenses (operating & financial) excluding fuel costs by the total number of ASKs |
| Load Factor | Expressed as both RPK/ASK and Passengers/Available seats for scheduled flights |
| Pax/flight | The ratio divides total passengers carried by total sectors flown |
| RASK (Revenue per ASK, in € cents) | Revenue per Available Seat Kilometer, where “revenue” refers to revenue from scheduled, charter flights, ancillaries and other operating income |
| Yield (Revenue per RPK, in € cents) | Revenue per Revenue Passenger Kilometer, where “revenue” refers to revenue from scheduled, charter flights, ancillaries and other operating income |
| RPKs (in millions) | Revenue Passenger Kilometers; the number of revenue passengers carried multiplied by the distance flown in kilometers. |
| Total available seats (000) | Represents the number of seats available flown |
| Total Block Hours | A block hour is the time from the commencement of the movement of an aircraft from its parking position at the departure airport until its complete immobilization at the airport of destination |
| Total Sectors Flown | Total number of point-to-point flights |
Detailed financial statements are available at www.aegeanair.com under the About Aegean / investor relations / Financial results section.
[1] EBITDA: Earnings (Losses) before interest, tax, depreciation & amortization


